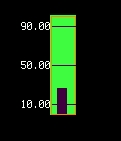
Simple test
Simple demonstration of the gauge library
examples/gauge_simpletest.py
 1# SPDX-FileCopyrightText: Copyright (c) Jose D. Montoya
 2#
 3# SPDX-License-Identifier: MIT
 4
 5import time
 6import board
 7from gauge import gauge
 8
 9# define the display
10display = board.DISPLAY
11
12# we create the gauge object
13gauge = gauge(
14    50,
15    50,
16    26,
17    100,
18    ticks=[10, 50, 90],
19    scale_range=[0, 100],
20    tick_color=0x440044,
21    background_color=0x44FF44,
22)
23
24# display the gauge in the screen
25display.show(gauge)
26
27
28# some dummy date to show library capabilities
29i = 20
30
31# we iterate
32while True:
33    for a in range(5):
34        gauge.update(i)
35        i = i + 10
36        time.sleep(0.0005)
37    for a in range(5):
38        gauge.update(i)
39        i = i - 10
40        time.sleep(0.005)
41    i = 20
AS7341 test
Example showing a AS7341 light sensor with up to 8 gages updating the different colors
examples/gauge_as7341_text.py
  1# SPDX-FileCopyrightText: Copyright (c) Jose D. Montoya
  2#
  3# SPDX-License-Identifier: MIT
  4
  5import time
  6import displayio
  7import board
  8from adafruit_as7341 import AS7341
  9from gauge import gauge
 10
 11i2c = board.I2C()  # uses board.SCL and board.SDA
 12sensor = AS7341(i2c)
 13
 14display = board.DISPLAY
 15group = displayio.Group()
 16
 17gauge1 = gauge(
 18    40,
 19    50,
 20    26,
 21    100,
 22    ticks=[0, 3000],
 23    scale_range=[0, 3000],
 24    tick_color=0x440044,
 25    box_color=0x9B26B6,
 26    background_color=0x9B26B6,
 27)
 28gauge2 = gauge(
 29    90,
 30    50,
 31    26,
 32    100,
 33    ticks=[0, 3000],
 34    scale_range=[0, 3000],
 35    tick_color=0x440044,
 36    box_color=0x4B0082,
 37    background_color=0x4B0082,
 38)
 39gauge3 = gauge(
 40    140,
 41    50,
 42    26,
 43    100,
 44    ticks=[0, 3000],
 45    scale_range=[0, 3000],
 46    tick_color=0x440044,
 47    box_color=0x0000FF,
 48    background_color=0x0000FF,
 49)
 50gauge4 = gauge(
 51    190,
 52    50,
 53    26,
 54    100,
 55    ticks=[0, 3000],
 56    scale_range=[0, 3000],
 57    tick_color=0x440044,
 58    box_color=0x00FFFF,
 59    background_color=0x00FFFF,
 60)
 61gauge5 = gauge(
 62    240,
 63    50,
 64    26,
 65    100,
 66    ticks=[0, 3000],
 67    scale_range=[0, 3000],
 68    tick_color=0x440044,
 69    box_color=0x00FF00,
 70    background_color=0x00FF00,
 71)
 72gauge6 = gauge(
 73    290,
 74    50,
 75    26,
 76    100,
 77    ticks=[0, 3000],
 78    scale_range=[0, 3000],
 79    tick_color=0x440044,
 80    box_color=0xFFFF00,
 81    background_color=0xFFFF00,
 82)
 83gauge7 = gauge(
 84    340,
 85    50,
 86    26,
 87    100,
 88    ticks=[0, 3000],
 89    scale_range=[0, 3000],
 90    tick_color=0x440044,
 91    box_color=0xFF6500,
 92    background_color=0xFF6500,
 93)
 94gauge8 = gauge(
 95    390,
 96    50,
 97    26,
 98    100,
 99    ticks=[0, 3000],
100    scale_range=[0, 3000],
101    tick_color=0x440044,
102    box_color=0xFF0000,
103    background_color=0xFF0000,
104)
105
106group.append(gauge1)
107group.append(gauge2)
108group.append(gauge3)
109group.append(gauge4)
110group.append(gauge5)
111group.append(gauge6)
112group.append(gauge7)
113group.append(gauge8)
114display.show(group)
115
116while True:
117    gauge1.update(sensor.channel_415nm)
118    gauge2.update(sensor.channel_445nm)
119    gauge3.update(sensor.channel_480nm)
120    gauge4.update(sensor.channel_515nm)
121    gauge5.update(sensor.channel_555nm)
122    gauge6.update(sensor.channel_590nm)
123    gauge7.update(sensor.channel_630nm)
124    gauge8.update(sensor.channel_680nm)
125
126    time.sleep(0.001)
Threshold Setting Example test
Example showing how to set the threshold limit to change the bar color
examples/gauge_threshold_setting.py
 1# SPDX-FileCopyrightText: Copyright (c) Jose D. Montoya
 2#
 3# SPDX-License-Identifier: MIT
 4
 5import time
 6import board
 7from gauge import gauge
 8
 9# define the display
10display = board.DISPLAY
11
12# we create the gauge object
13gauge = gauge(
14    50,
15    50,
16    26,
17    100,
18    ticks=[50],
19    scale_range=[0, 100],
20    tick_color=0x0000FF,
21    background_color=0x44FF44,
22)
23
24gauge.set_threshold(value=50, color=0xFF0000)
25# display the gauge in the screen
26display.show(gauge)
27
28
29# some dummy date to show library capabilities
30i = 20
31
32# we iterate
33while True:
34    for a in range(5):
35        gauge.update(i)
36        i = i + 10
37        time.sleep(0.05)
38    for a in range(5):
39        gauge.update(i)
40        i = i - 10
41        time.sleep(0.05)
42    i = 20
Horizontal Gauge
Example showing how to set horizontal gages
examples/gauge_horizontal.py
 1# SPDX-FileCopyrightText: Copyright (c) Jose D. Montoya
 2#
 3# SPDX-License-Identifier: MIT
 4
 5import time
 6import displayio
 7import board
 8from gauge import gauge
 9
10
11display = board.DISPLAY
12
13group = displayio.Group()
14palette = displayio.Palette(3)
15x0 = 5
16y0 = 5
17points = [(x0, y0), (100, 20), (20, 20), (20, 100)]
18palette[0] = 0xFF0000
19palette[1] = 0x00FF00
20palette[2] = 0x0000FF
21
22
23gauge1 = gauge(
24    20,
25    15,
26    28,
27    100,
28    ticks=[10, 50, 90],
29    scale_range=[0, 100],
30    tick_color=0x0000FF,
31    background_color=(0, 3, 39),
32    show_text=True,
33)
34
35gauge1.set_threshold(value=50, color=0xFF0000)
36
37group.append(gauge1)
38
39
40gauge2 = gauge(
41    60,
42    80,
43    28,
44    100,
45    ticks=[10, 50, 90],
46    scale_range=[0, 100],
47    tick_color=0x0000FF,
48    background_color=0x00FF00,
49    show_text=True,
50    direction="Horizontal",
51)
52
53gauge2.set_threshold(value=50, color=0xFF0000)
54
55group.append(gauge2)
56
57display.show(group)
58
59i = 20
60gauge1.update(i)
61gauge2.update(i)
62# we iterate
63while True:
64    for a in range(5):
65        gauge1.update(i)
66        gauge2.update(i)
67        i = i + 10
68        time.sleep(0.1)
69    for a in range(5):
70        gauge1.update(i)
71        gauge2.update(i)
72        i = i - 10
73        time.sleep(0.1)
74    i = 20